Final 2024 life expectancy at birth ranges from 71.1 to 85.8 years
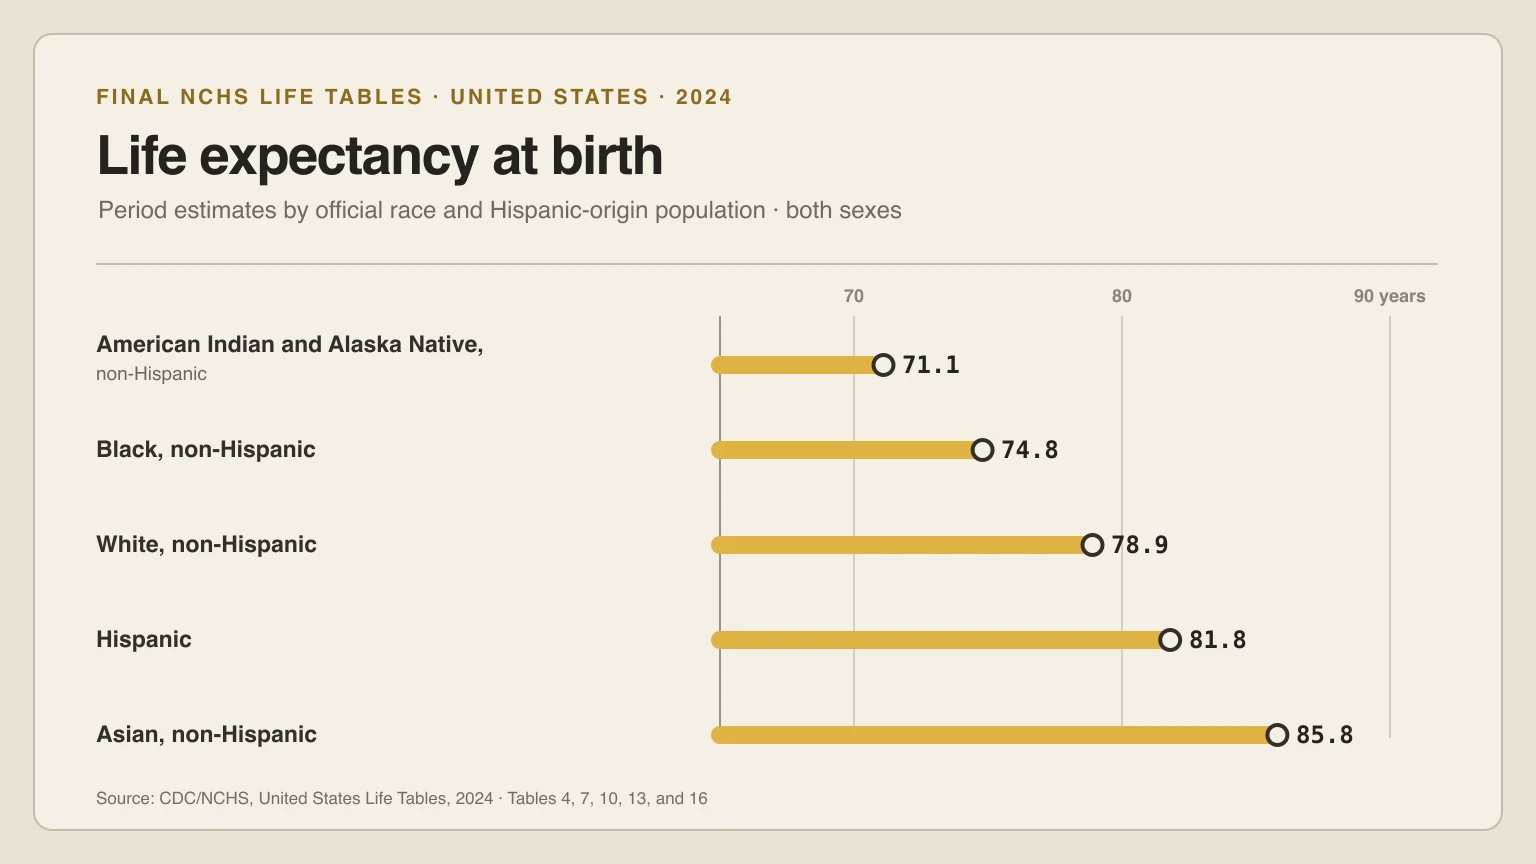
In the final 2024 National Center for Health Statistics life tables, period life expectancy at birth is 85.8 years for Asian, non-Hispanic people, 81.8 for Hispanic people, 78.9 for White, non-Hispanic people, 74.8 for Black, non-Hispanic people, and 71.1 for American Indian and Alaska Native, non-Hispanic people. These are the official both-sex estimates for the U.S. resident population—not individualized predictions.
| NCHS population | Both sexes | Male | Female | Source tables |
|---|---|---|---|---|
| Hispanic | 81.8 | 79.2 | 84.3 | 4, 5, 6 |
| American Indian and Alaska Native, non-Hispanic | 71.1 | 67.8 | 74.6 | 7, 8, 9 |
| Asian, non-Hispanic | 85.8 | 83.7 | 87.7 | 10, 11, 12 |
| Black, non-Hispanic | 74.8 | 71.3 | 78.2 | 13, 14, 15 |
| White, non-Hispanic | 78.9 | 76.7 | 81.3 | 16, 17, 18 |
Source: CDC/NCHS, United States Life Tables, 2024, Table A and Tables 4–18. The report was published August 25, 2026. At birth, the exact workbook locator is cell G4: the age 0–1 row in the expectation of life at age x (ex) column. Values above use the report’s one-decimal presentation.
Final NCHS period tables
Compare five published populations by exact age
Choose an attained age and one published sex table. Every result is read from the same ex field in Tables 4–18; no values are interpolated.
Both sexes, at birth. The five published estimates range from 71.1 to 85.8 remaining years.
For the both-sexes population at birth, the five published estimates range from 71.1 to 85.8 remaining years.
- Highest published value
- 85.8 years Asian, non-Hispanic
- Lowest published value
- 71.1 years American Indian and Alaska Native, non-Hispanic
- Descriptive range
- 14.7 years Published high minus low
- Hispanic81.8 yearsTable 4
- American Indian and Alaska Native, non-Hispanic71.1 yearsTable 7
- Asian, non-Hispanic85.8 yearsTable 10
- Black, non-Hispanic74.8 yearsTable 13
- White, non-Hispanic78.9 yearsTable 16
Exact age means age at the start of the source interval. The final “100 and over” row is open-ended, not a one-year age-100 interval. Values are displayed at the report’s one-decimal precision; downloads retain the source XLSX precision.
“Race and gender” is not the source field
“Life expectancy by race and gender” can obscure what the NCHS tables publish. The source has separate male, female, and both-sexes life tables; it does not measure gender identity. The controls, table headings, downloads, and interpretation therefore use “sex” rather than silently relabeling the source variable.
The population labels also combine two different fields. “Hispanic” is an origin category and people in it may be of any race. The other four published groups are non-Hispanic single-race categories under the 1997 federal reporting standard. NCHS does not provide a combined non-Hispanic total or separate Native Hawaiian and Other Pacific Islander, multiracial, or “other race” life table in Tables 4–18. This dataset leaves those combinations unpublished instead of assigning zero or manufacturing an estimate. See the report’s race and Hispanic-origin classification notes.
The published 2024 Black–White differences are 4.1, 5.4, and 3.1 years
Subtracting the published Black, non-Hispanic estimate from the published White, non-Hispanic estimate gives a 4.1-year difference for both sexes, 5.4 years for males, and 3.1 years for females. These are transparent descriptive comparisons, not claims that the underlying differences are statistically significant.
both sexes: 78.9 − 74.8 = 4.1 yearsmale: 76.7 − 71.3 = 5.4 yearsfemale: 81.3 − 78.2 = 3.1 yearsThe calculation deliberately uses the numbers readers see in Table A. Subtracting the higher-precision XLSX cells before rounding can differ by one tenth because each published estimate was rounded first. The page never substitutes that arithmetic for an uncertainty interval or an explanation of causes.
Every value is a 2024 period estimate, not a forecast
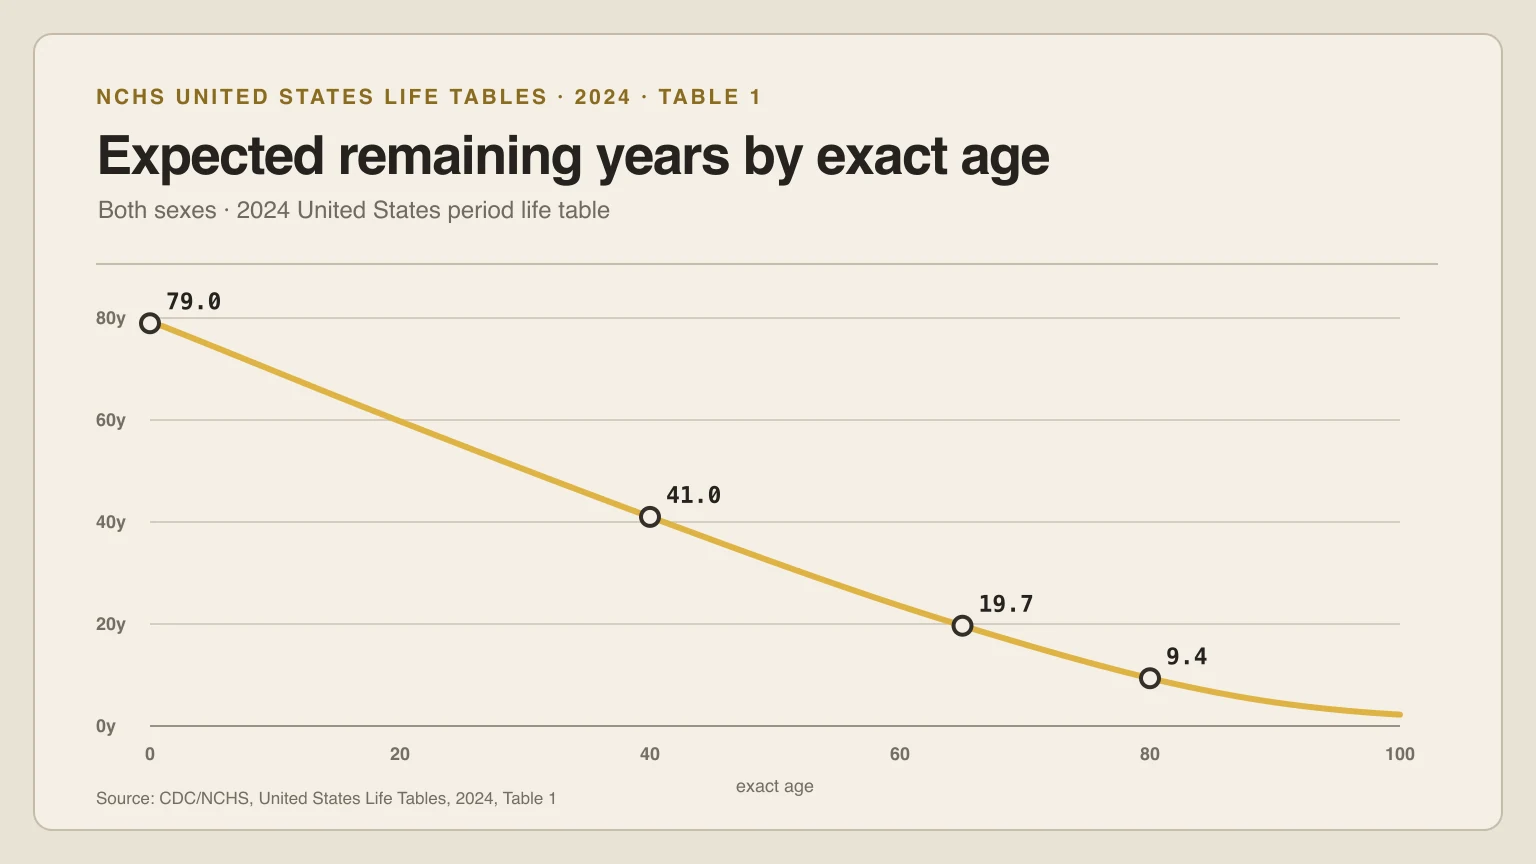
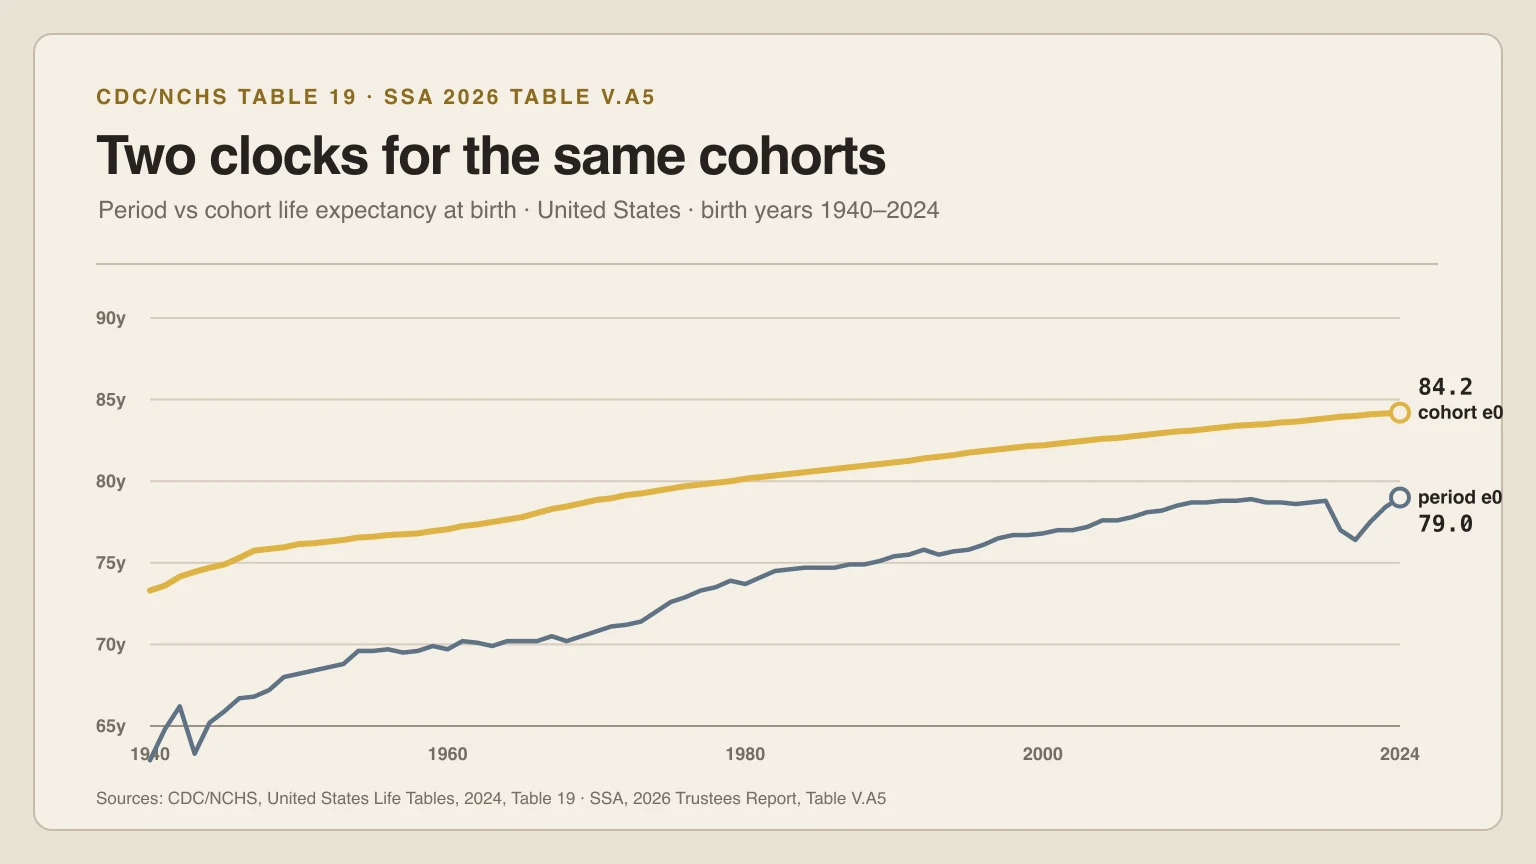
A period life table applies the age-specific mortality rates observed in 2024 across a hypothetical lifetime. At birth, e0 summarizes that mortality schedule. At exact age x, ex is the average additional lifetime among the life-table population that has already survived to age x. Neither quantity says how long a named person will live or how the mortality rates encountered by a real cohort will change in later years.
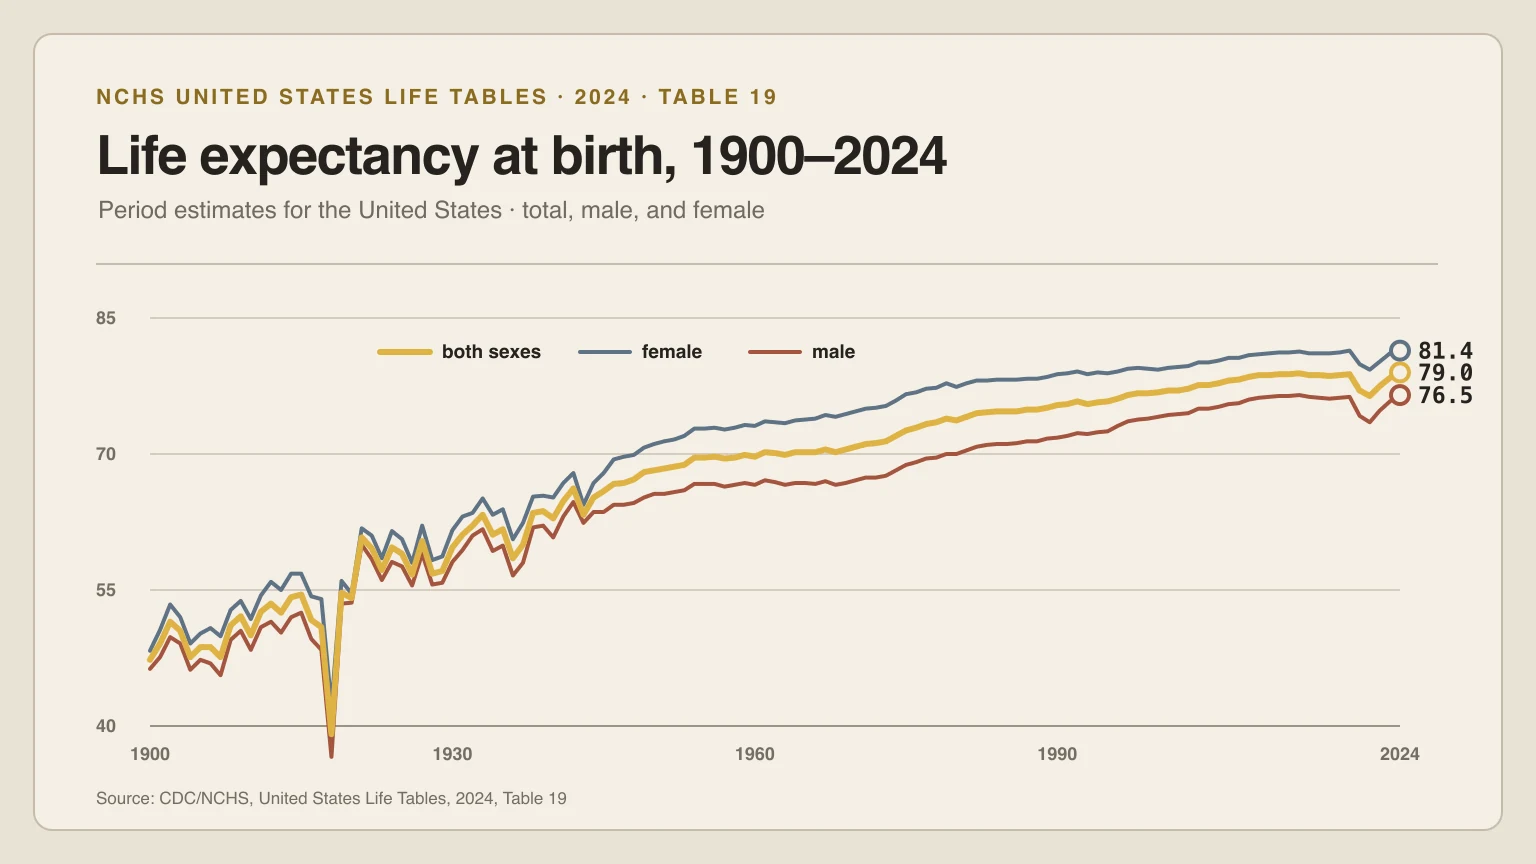
The explorer retains all 101 attained-age rows from each source workbook. Ages 0–99 identify the start of one-year intervals. The terminal source row is 100 and over: it is open-ended and cannot be interpreted as an age-100-to-101 estimate. For the national total, male, and female tables without subgroup classification, use the 2024 life expectancy by age explorer. For calendar-year history, use the 1900–2024 national series.
NCHS adjusts classification and models mortality at the oldest ages
Race and Hispanic origin on death certificates can differ from self-report. NCHS adjusts deaths at ages 1 and older with age- and sex-specific classification ratios. Hispanic, Asian non-Hispanic, Black non-Hispanic, and White non-Hispanic ratios come from National Longitudinal Mortality Study linkages; the American Indian and Alaska Native non-Hispanic ratios come from a 2010 Census–National Death Index linkage. Infant estimates instead use linked birth and infant-death records and the mother’s birth-record classification. The exact procedure is in the report’s Technical Notes on classification.
Mortality at the oldest ages is also modeled rather than read as a simple raw rate. The total, Black non-Hispanic, and White non-Hispanic tables incorporate Medicare-supported older-age estimates and Kannisto smoothing. Hispanic and Asian non-Hispanic tables use a Brass relational-logit fit with White non-Hispanic mortality as the standard; the American Indian and Alaska Native non-Hispanic tables use a related fit over a different age range. Those choices are documented in Technical Notes and Tables IV–V.
The report does not publish subgroup confidence intervals
Tables 4–18 do not provide estimate-level standard errors or confidence intervals for remaining life expectancy. The standard errors in Technical Tables IV and V belong to fitted old-age model parameters, not to the displayed life-expectancy estimates. The downloadable records therefore label standard errors and confidence bounds as not published, and this page makes no significance claims.
Do not read the ordering as a biological ranking. These are population summaries shaped by the source classifications, observed mortality, data correction, and life-table methods. The tables do not isolate causes or determine an individual outcome.
These official NCHS categories are also not an income ranking. The daily chart’s baseline comes from the Chetty income series, not from a race-or-sex row in Tables 4–18. The two sources use different grouping variables, starting ages, study periods, and measures, so their values are not interchangeable.
Download all 1,515 exact-age observations
The normalized dataset contains five official population groups × three sex tables × 101 attained-age rows. Each record includes the source table, workbook, field, direct URL, pinned SHA-256, raw XLSX value, published one-decimal value, interval semantics, and classification fields. The JSON includes a codebook and dataset-level method notes; the CSV is rectangular and ordered by population, sex table, and age.
The underlying NCHS workbook directory is a U.S. government source. Life Days Left’s normalization is independently prepared, links every row back to the source artifact, and does not imply CDC endorsement. Corrections are versioned through the site corrections policy.